Find your most profitable customers with Recency, Frequency, and Monetary Value (RFM) analysis. We identify the best segments to target and show you how with examples and case studies.

‘Half the money I spend on advertising is wasted; the trouble is I don't know which half’ - John Wanamaker.
We can all relate. But with the help of RFM analysis, the chance that you’re marketing to the right customers (and spending less on the wrong ones) dramatically improves.
Instead of marketing to all customers in the same way, you’ll be able to use RFM analysis to identify which customers:
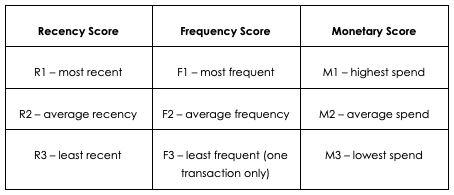
RFM analysis stands for Recency, Frequency, and Monetary Value. It’s a way of segmenting customers based on when they last purchased, how often they’ve purchased, and how much they’ve spent in total.
Along with Customer Lifetime Value (CLV), RFM analysis is a popular segmentation methodology used by businesses to understand who their best customers are based on their purchase history and customer behavior.
The RFM model assigns a value to each customer based on how they score in each category and combines them to make an RFM score. You can then market to those customer segments separately, with bespoke offers and messaging.
The highest value customer will be someone…
Although RFM segmentation has its roots in direct mail and database marketing, it’s now one of the key metrics used by marketers in the ecommerce industry.
Here’s why eCommerce brands are so focused on customer segmentation using models like RFM analysis…
Some customers will buy a cheap item from your online store once and disappear into the night, never to return. From our data, we typically see ecommerce churn rates around the 65% mark.
Other customers will snap up everything you offer, rave about your business to all their friends and even get your brand tattooed on their body to show the world just how much they care.

We found the top 5% of customers spend ten times more than everyone else, and typically generate a third of total revenue.
RFM analysis is a customer segmentation technique that helps brands split their customer base into low, medium, and high-value customers.
When you know who your most valuable and loyal customers are, you can focus your customer retention efforts on keeping them happy.
What’s more, your customer acquisition becomes more focused.
Remember: your job isn’t to find more customers, it’s to find more new customers that share the same behavior and demographics as your high-value segments (hello, Facebook Lookalike Audiences!)
Use RFM analysis to identify customers who are highly engaged, make multiple purchases over a short-time frame and who spend a lot of money...and then put your marketing hat on to find more customers that share those attributes.
You can also identify which marketing channels and campaigns are pulling in the low-value, one-and-done customers with low CLV and reallocate their budget elsewhere.
Brands that use segmentation techniques like RFM analysis for their marketing campaigns can see a 200% increase in conversions.
Segmenting your marketing campaigns using customer data can also result in large increases in customer experience, visitor engagement, and response rates.
And yet, 3 in 4 ecommerce brands don’t use it!
But with tools like Segments that automatically create customer segments for you, using RFM to increase your Return On Investment is easier than ever.
(If your online store is built using Shopify, make sure to take advantage of Segments 14-day free trial.)
Now you know what RFM analysis is and why it’s so important for ecommerce brands, let’s cover how you can conduct your own RFM analysis in Excel:
Begin by exporting your customer and order data into an Excel spreadsheet or database. Here’s how you do it for both customers and orders if your ecommerce brand is built on Shopify.
Then create three columns next to each customer’s data. You’re going to assign each customer a score from one to three based on their Recency, Frequency, and Monetary Value.
Once complete, you’ll have a list of customers like this:
John Smith, johnsmith@madeupemail.com – R1, F3, M1.
This can be read as someone who has bought from you recently (R1), has only made one purchase (F3) and who spent a lot (M1).
The next step is to segment the customers who share the same attributes. You should have 27 groups of customers altogether.
But a list of letters and numbers like R1, F3, M1 isn’t particularly useful, so let’s tweak them to be more user-friendly for our marketing campaigns. That way, you can personalize your campaigns to each customer segment. You can check your Lifecycle Journey based on the RFM model in our Segments App:

Here are some of the most useful RFM segments:
This group is made up of customers who have recently purchased from you for the first-time. Strike while the iron’s hot.
Build cross-sell campaigns to show them relevant products or give them incentives to complete a second purchase, like a discount that runs out or has a limited number of uses to take advantage of the scarcity (or FOMO) principle.
Cross-selling campaigns show buyers personalized suggestions based on what they’ve already bought, and can be highly effective. Skyn ICELAND, for example, increased their AOV by 15% using this strategy to show buyers a relevant product.
Here’s a simple cross-sell email example from Matalan. It references the fact that the customer has bought an item of school uniform and suggests other related items.

You should also build email flows and remarketing campaigns to turn your R1s from a one-time purchaser into a repeat purchaser. You can create filters and exclusions to remove them as soon as they make their second purchase.
Loyal customers have made a large number of purchases from you, and are often the most likely to recommend you to their friends and family. It’s six-to-seven times cheaper to retain a customer than acquire a new one, and increasing retention rates by 5% could increase profits by up to 25%.
Combine this with frequency scores to find those at risk of churning (R2) and those who have already churned (R3) to bring them back. Reward these customers with a loyalty program where they can redeem points. Check out our Customer Retention article where we identified seven of the highest-rated loyalty program apps available on Shopify.
Luxury fashion brand, Luisaviaroma, used a tiered reward system based on high AOVs (the M1 segment) to create a loyalty program that generated a 300% ROI.
These customers haven’t made a recent purchase, and the longer it’s been since they purchased from you, the less likely they are to buy from you again. As with the ‘one-timers’ customer segment, focus on those who have spent the most (M1.)
Create an email sequence or retargeting audience and provide an incentive like free shipping, a 2-for-1 deal, or a discount to keep them interested and reduce your churn rate.
Given that they’re most at risk, be prepared to send multiple emails and deep discounts. As long as you’re making a small profit on each transaction, it should be worth it to keep these customers engaged.
.png)
This example from Remarkety shows that churn emails can be simple. It references the fact that the customer hasn’t shopped recently, offers an incentive to buy again, and showcases three top categories. If you wanted to improve on this, you could make the recommended items specific to customers’ previous orders.
People in this segment are your best customers – they’ve bought recently, they’ve bought from you many times before and they’re big spenders! Keep these customers around with a customer retention program and offer high-level customer service to make them happy.
Analyze these customers to find out which marketing channel and campaign brought them to your online store and which product they bought first, then double-down on the results.
Use this customer data to build Lookalike Audiences (LLAs) for your ad campaigns. When Growth Cave swapped out their LLA audience made up of their previous customers from the last six months, for one that only included customers with a high Average Order Value, their ROI increased by 44%.
Lucas Lee-Tyson, owner of Growth Cave, commented:
‘Clearly, the data you feed into Facebook has a massive result on the type of results you get. Since I’m ‘telling’ Facebook to find me more people like the people that have high average order values, Facebook has a better idea of what sorts of customers I’m actually looking for. And the results speak for themselves.’
While RFM analysis is a useful customer segmentation method, it does have its flaws. The simplicity of looking at three factors means that while it’s easy to do, it ignores other potentially important aspects, like:
It’s important to note that RFM analysis is based on past behavior. So when you use that data, you’re assuming how customers have acted in the past is a good indication of future activity, which isn’t always the case. Big events like Black Friday and Cyber Monday, as well as seasonal buying, can heavily skew results.
Granted, RFM analysis won’t tell you other important details, like average time to purchase, Customer Lifetime Value, and which products are most suitable to cross-sell.
The good news? There are other options.
If you’re an ecommerce brand looking for automated customer segmentation software that will create segments for you and integrates with your email provider, Segments is designed for you.
Sign up to Segments’ free 14-day trial for:
Wondering if Segments is for you? Try it out for 14 days, for free.
Want to learn how to understand and improve other important metrics and benchmarks for your online store?
Read our in-depth ecommerce guides here:
Effortlessly plan with free monthly calendar created by data scientist in Segments
Find out top campaigns from top brandsJul 4
Independence day
Oct 7
World Smile Day
Jun 21
National Selfie day
Subscribe to our newsletter & stay updated
Fill in the information and we will send you an email to schedule a demo call shortly.


