Which metrics you should be looking at
Ecommerce platforms usually give you some analytics. The problem is those analytics are almost always a mess of metrics and timeseries that don’t really explain what’s what, why you should care, and what you should be doing next.
This guide organizes ecommerce analytics into a “funnel” framework with different stages:
Acquisition
- Sessions
- Unique users
- Signups
Activation
- New first-time customers
- Activated first-time customers
Retention
- Repeat customers
Churn
- Unsubscribes
- Inactives
We will cover which metrics you should be tracking in each stage, what they mean, and what you can do to improve them.

Why funnel analytics
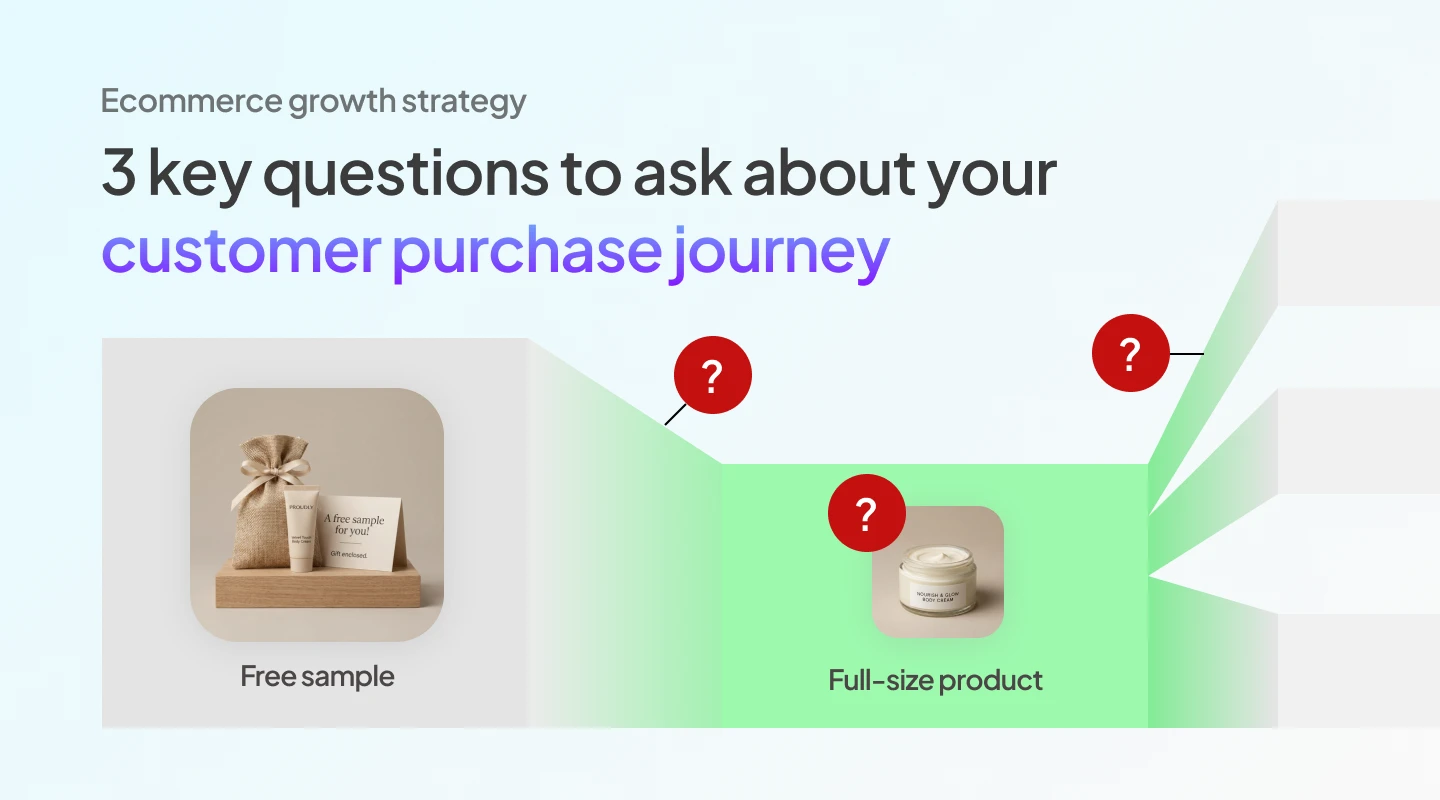
People naturally follow a somewhat linear path to the final end result of “getting value” from a business, usually purchasing a product. In analytics parlance we call this path a “funnel” because of the way the total pool of people in each stage decreases the further along the path they go. Think of how you personally decide to buy something online:
- Maybe you see an ad a few times that catches your eye
- You click the ad and browse their website
- You sign up to claim a discount and get a newsletter update
- A couple days later, you make your first purchase
- A week later, they email an offer for a complementary product
- You decide to purchase that as well
It sounds easy, but 100 people starting at step 1 can very easily end up with only 1 person by step 6.
By mastering your funnel analytics, you can figure out where your business is doing well and, more importantly, which stages you can improve to convert more of your customers towards getting more value further down the funnel.
Funnel analytics provides an intuitive structure to measure business health and can help you make better decisions.
We’re the founders behind Segments, the best customer analytics app for building funnel analytics (and more!)
What about advertising platforms?
Facebook, Instagram, Google Ads, Amazon, Pinterest, Snapchat… each of the advertising platforms provides their own analytics. Most of the time, the reported results won’t be exactly the same, even if you’re looking at the same thing — try comparing website visits from Facebook, vs what Google Analytics says, vs what a platform like Shopify says. Different platforms use different methodologies and things get lost in translation.
We’ll be adding to this guide as we get more detailed in our methodology. For now we focus on the “source of truth” platform, which is what you control: your website, and the results from your ecommerce platform.
The Funnel Stages
We said earlier that the “buyer journey” is a linear path, but in reality customers will go in and out of different stages. Keep this in mind as we go through each stage; a churned customer may remember your product enough to get value again right away, but they may also need to be “activated” again.
Let’s get to it.
Note: Where/how to get the metric will be (`appended after`) the definition
Acquisition
- Sessions
- Unique users
- Signups
Sessions, aka traffic, are visits from people to your site. Each session can have multiple Page Views. One of the most important attributes of this top-of-funnel metric is which channel a session is coming from: Organic (Google search), Paid (FB ads, etc), Referral (link someone shared), and Direct (typing in your site name or bookmark). (`Google Analytics`, `Ecommerce platform`)
When you have enough data from sessions converting to customers, you can begin monitoring Customer Lifetime Value (CLV) of users from different channels. The higher the CLV of users from a particular channel, the more you can afford to spend there.
Unique users (UU) combines sessions together to represent a single user. This user can come back to your site multiple times for multiple sessions. The accuracy of UUs depends on cookies — if all of your visitors are using cookie-blockers or private browsers, then you will have the same number of sessions as UUs. (`Google Analytics`)
Signups happen when a user gives you their email. This event is a big milestone in your funnel, so you shouldn’t be surprised to see a big drop-off from UUs to signups. Browsing a site is low commitment; it only takes a few seconds to skim and a visitor can move on with their day. Giving an email is a strong indicator that someone is interested in your product or content, so much so that they either created a profile and started to check out, or signed up to receive any emails and offers you send. (`Ecommerce platform`, `Email service provider`)
When a visitor signs up for email, it is a voluntary action and explicitly states that they want to receive emails from you. When a visitor creates a profile to check out, they may not want to receive marketing newsletters. Be careful of which definition you are using when taking action. In Shopify, you can differentiate these signups by the “Accepts Marketing” flag.
What about content views, add-to-carts, and initiate checkouts? These are more granular stages of your funnel somewhere between unique users, signups, and first-time customers. If you have access to this data (FB pixel, Google Analytics events, etc), then you’re in good shape and you can look to optimize even further. If not, don’t sweat it — you can build a solid foundation with just these metrics.
Activation
- New first-time customers
- Activated first-time customers
New first-time customers are users who signed up and bought something for their first time (congratulations!) in the specified time period. A lot of stores will stop here as the ultimate end-goal of their funnel. Brands are rarely one-and-done, however, and it’s shortsighted to simply forget about these customers. You’ve already done most of the hard work to get them this far down the funnel; if your products are great, then these first-time customers can become your long-term loyal repeat customers. (`Ecommerce platform`, Segments)
Activated first-time customers are also first-time customers, but who signed up (ie. gave their email) sometime before the specified time period. We differentiate between new and activated first-time customers because they come from different parts of the funnel; if you have 100 signups with 50 new first-time customers, then you're converting 50% of your acquisition efforts. If none of those 100 signups converted however, and you have 50 activated first-time customers instead, then your acquisition isn't doing so well (at least in this particular time period view) but your activation efforts are still decent. This nuance is important and it could be useful to adjust your time period view to reflect how long it usually takes for new signups to convert (see the following supplementary metric). (`Segments`)
Supplementary metric:
Average days to first purchase (ADFP). Understanding the amount of time it takes for a signup to first purchase can inform what time period makes sense to view your funnel, and what kind of email or retargeting campaigns to run. For example, if it takes 2 weeks for new signups to be comfortable enough to purchase (for whatever reason), then you'll want to look at a time period of at least 2 weeks for your funnel to make sense. For marketing campaigns, let's it takes 7 days on average for conversions without any marketing; then you can experiment with an educational email campaign on day 8 to assure those still on the fence that your product is worth it. You can also try 3rd-day emails, or 2nd-day emails, or even later emails. In general you should be experimenting all the time, and a metric like ADFP is a reference point for where you can start. (`Segments`)
Retention
- Repeat customers
Repeat customers are your customers that have bought something in the past, and have come back to buy again. In general the older and more mature your store, the more repeat customers you should be getting. Brand loyalty has become increasingly important and loyal repeat customers are the surest indication that you've got a great brand. (`Ecommerce platform`, Segments)
Supplementary metrics:
Average days between purchases (ADP), similar to ADFP, informs where to begin experimenting with your repeat customer campaigns. The lower this number, the faster your customers are realizing value and coming back again to purchase. (`Segments`)
Average tenure is the number of days between a customer’s first purchase and their “final” purchase before they churn (see the next section for inactive users). The higher this number, the more (generally) your customers are sticking around and buying. (`Segments`)
Churn
- Unsubscribes
- Inactives
Unsubscribes are users that have opted out of receiving emails from your site or newsletter. The unsubscribe action usually happens when a user receives an email from you, and explicitly clicks the “unsubscribe” link (or worse, they “reported as spam”, which penalizes your email domain). Unsubscribes do not necessarily mean someone will no longer buy from you, but you will no longer have a direct way to market to them. (`Ecommerce platform`, Email service provider)
Inactives, or “churned” users, can be defined a number of different ways, but the general idea is that these users have not bought anything or engaged with your site for a significant period of time. In our app Segments, we define inactives as users who have not purchased for 2x ADP, and we recommend suppressing these users with your email service provider. (`Segments`)
Where to go from here
Set up tracking of your funnel across all of the metrics we've discussed. As you continue executing on your store, you will start getting a feel for what are good and bad conversion rates from one stage to the next. Every industry and niche is different, so general benchmarks may not be applicable. Keep track of any big changes you make and see how your funnel is affected. Remember that seasonality is a thing.
Acquisition
- Sessions
- Unique users
- Signups
Activation
- New first-time customers
- Activated first-time customers
Retention
- Repeat customers
Churn
- Unsubscribes
- Inactives
Avoid the Leaky Bucket

A "leaky bucket" happens when, despite your best efforts of adding users into the top of the funnel, more users are leaving and not staying to engage with your brand. We want a full bucket with happy customers continuously getting value from your site.
Master your funnel analytics to keep your bucket full and expanding!
Authored by
Tresl Data Science Team

George Sylvain
George Sylvain is a San Francisco-based DTC expert and co-founder of Social Print Studio, known for transforming e-commerce strategies into success stories. Visit his insights on AI and Shopify at www.georgesylvain.com.

Sharad Thaper

Alex Greifeld