Operating and growing your online store isn’t just about sales…
It’s about using data to ask the right questions and make smart, informed decisions.
That’s why getting to grips with Shopify Analytics is essential - it’s your competitive advantage, and if you’re not using it, you’re leaving money on the table.
You can use Shopify Analytics to understand who your customers are, which products to sell, and when you should double-down on a marketing channel.
Here’s what you’re going to learn today:
- What data Shopify Analytics provides you with.
- Where you can find the information you really need, without spending hours digging through meaningless metrics.
- How to add Google Analytics to Shopify to get even more data.
- How to turn data into actionable insights that allow you to sell more using our Shopify Analytics ‘Cheat Sheet’
In this Shopify Analytics tutorial, we’re going to show you everything you need to know to increase your online sales, including exactly where you need to go to find answers to the most common questions we hear from store owners.
What is Shopify Analytics?
Shopify Analytics is Shopify’s built-in data dashboard. It helps ecommerce store owners understand how their business is performing and how to improve.
While it has its limitations (more on that later!), it blows the competition out the water.
Shopify Analytics is the place to go to find answers to questions like:
- How many products did we sell last week?
- What were the most popular items we sold?
- Where are our customers coming from?
- What’s our Average Order Value (AOV)?
- Which marketing channel is generating the highest Return On Investment (ROI)?
But finding the right data can be a challenge. Where should you look? How do you customize it? How do you turn data into an actual live business decision?!
After all, as Avinash Kaushik, Google’s Digital Marketing Evangelist, frequently reminds us:
‘Most businesses are data rich and information poor.’
So how can you take the data in Shopify Analytics and turn that into actionable insights that allow you to sell more?
We cover all that below, so keep reading!
Why you should use Shopify Analytics for your online store
If you're already sold on the power of data, then please feel free to skip to the next section...
For those that need a little convincing, let’s take two Shopify store owners, identical in every way but one:
- Business A makes all their decisions on instinct by ‘going with their gut.’
- Business B uses a combination of data, instinct and experience to decide what they should do.
If you were to bet your life savings on one, which do you think is going to be more profitable in 12 months’ time?
Hypotheticals aside, when data is used in the right way, it helps you understand what’s working and what’s not.
Measuring your Shopify store’s key metrics against KPIs helps you make better decisions.
And better decisions mean less wasted ad spend on Facebook, higher Average Order Values, and more profit!
But in order to take action, you need to turn data into usable insights. For more advanced data needs, businesses often turn to experts for a tailored solution. Partnering with a Shopify Plus agency ensures your analytics and store performance are optimized to handle complex data requirements, driving better decision-making and business growth.
.png)
How to use Shopify Analytics to improve your online store
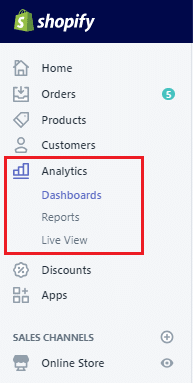
Let’s begin by logging in to your Shopify Account and clicking ‘Analytics’ on the left-hand side of the screen.
Shopify Analytics has three sections: Dashboards, Reports and Live View.
Shopify Overview Dashboard
This is the best place to get a basic understanding of how your store is performing and to gain insights into your customer behaviors. Think of this as a snapshot of all the most important information.
On this page, you can:
- Compare one sales channel against another to see which is performing better.
- Check your Average Order Value to see how it’s changed based on products you’ve added, pricing increases or your marketing campaigns.
- See which locations your customers are coming from and which social media platform is sending you the most traffic.

You can use the date selector button on the top-left of the screen to compare one period of time to another to see how things have changed. If you want to dig deeper into key metrics, click ‘View Report’.
Here are the ecommerce analytics metrics you’ll be able to view, along with a definition.
Sales and Product Metrics
- Total sales - the amount of revenue you brought in through your online store and your Point Of Sale (POS) if you have a physical brick-and-mortar store.
- Sales by source - the amount of sales that came from social media channels or other traffic sources.
- Total orders - the total number of orders from your online store and your physical store if you have one.
- Sales attributed to marketing - the total number of sales that Shopify believes has been driven to your online store through your marketing. (Be warned, we’ve found this number to be inaccurate, so if in doubt, double-check your Google Analytics tool.)
- Average Order Value - this is the average number of dollars you make per transaction, calculated by adding up your total revenue for the time period and dividing it by the number of transactions.
- Online store conversion rate - the percentage of sessions that lead to a purchase. You can also see the percentage of sessions where a visitor added at least one product to cart, where they reached the checkout and where they completed a purchase (called ‘Sessions Converted’.)
- Top products sold - see which products are selling the most so you can order more inventory or create marketing campaigns that feature these products.
(💡 Top tip - a ‘Bestseller’ Facebook ad using a Carousel format usually performs well.)
Visitors and Customer Metrics
- Online store sessions - See how many times customers viewed your store, what device they were using, which location they were in, which traffic source they came from and whether they came by a certain social media platform, like Facebook, Instagram or Pinterest.
- Top landing pages - identify the website pages where most visitors start their journey.
- Returning customer rate - The percentage of customers who bought from you more than once in the selected time period.
Shopify Analytics Reports
The section under dashboards is called Reports. The more advanced your Shopify plan, the more reports you’ll be able to use.
Here’s a quick glance at what you get on each plan, dependent on pricing:
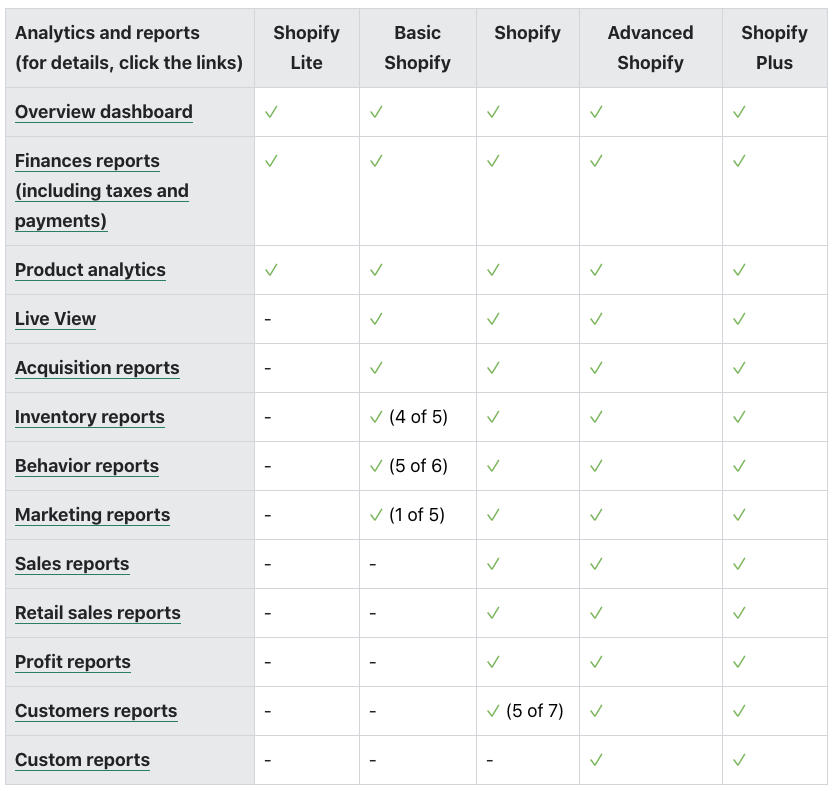
Now, let’s talk about some of the more useful reports.
Shopify Acquisition Reports
Acquisition reports tell you about your website sessions over time, by referrer and by location, so essentially, how much website traffic you have and where it’s coming from.
At this point you might be asking ‘how does Shopify define a session or a visitor’? Well, they place cookies on a shopper’s smartphone or computer when they visit your online store.
Shopify judges that a session ends after 30 minutes of no activity, or whenever it hits midnight UTC.
The important thing to remember is that if the same person visits your site twice, that will be recorded as one visitor but two sessions. Your number of sessions will normally be higher than your number of visitors.
Shopify Behavior Reports
Behavior reports are one of the most useful tools you have at your disposal when it comes to Shopify Analytics.
Use Shopify’s behavior reports to see how:
- Your online store conversions have changed over time.
- What your top online store searches are.
- How your product recommendations have changed over time.
- How fast your online store is compared to others, and
- How your sessions are split between landing pages and devices.
Let’s take a look at some of the key Behavior reports in Shopify Analytics.
Online store conversion over time report
Use this report to see how your conversion rate has changed over a specific date period, for example, one month to the next.
This is a great way to test whether the changes you’re making to your store are working.
Here’s a common situation to show how you can use this Shopify report:
You see that your store’s conversion rate over the last month was 1.8%. You decide that you want to change your homepage so your bestsellers are at the top. You look a month later and find that the conversion rate has increased to 2.1%.
Now, in an ideal world, you’d use A/B split testing to see which version of the homepage converted better. But most ecommerce stores don’t have the traffic or number of conversions required to do this.
Instead, you can do the next best thing and use common sense combined with customer feedback to make the products that people love more visible.
Becky Shuck, Owner of Stript Cosmetics, realized that she might get more sales by featuring her most popular product on her homepage:
‘Our Stay Fab Bath Bomb had been far outselling everything else in its category, so I moved it to our homepage to get more attention. The number of views to that product page rose significantly and so did our conversion rate - now it sells out on a regular basis!’

Optimizing your Shopify Checkout
What do you do if you use Shopify Analytics to check your conversion funnel and discover you have a low conversion rate?
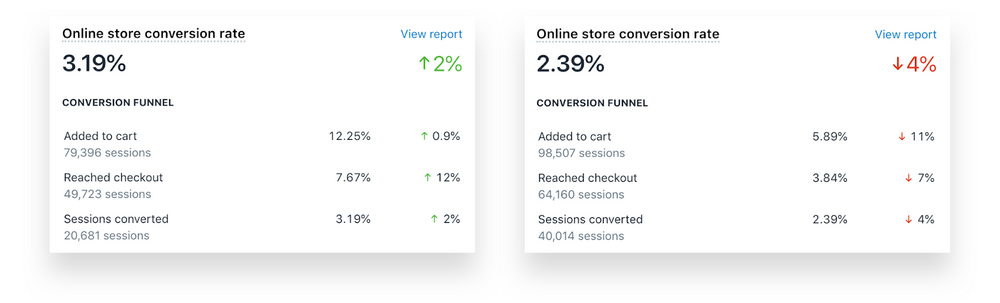
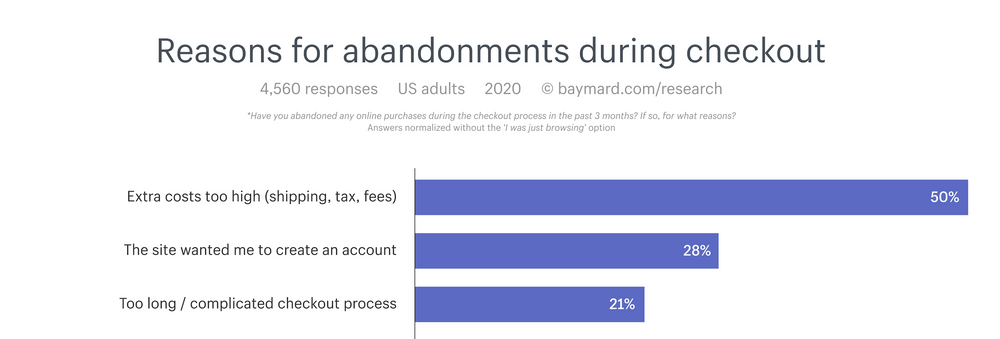
If you see that a high percentage of people are dropping off between the ‘Added to cart’, ‘Reached checkout’ and ‘Sessions converted’ metrics then you need to critically analyze your checkout.
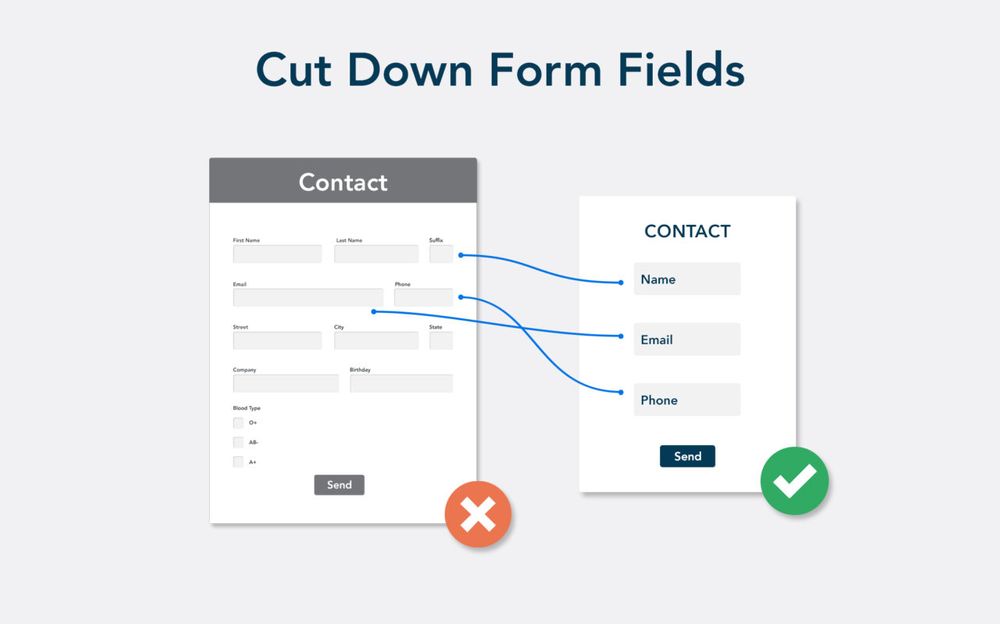
Are there barriers, such as unnecessary form fields?
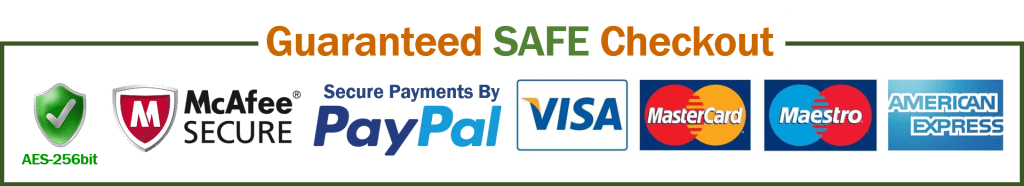
Does your checkout inspire trust?
Are higher-than-expected shipping costs driving customers away?
Once you discover which issues may be causing the drop-off between adding to cart and converting, Shopify Plus brands can use scripts to solve these issues and do things like:
- Offer a free gift or discount with purchase.
- Give a first time customer or new subscriber discount.
- Auto-select default payment method.
- Let visitors know about shipping costs upfront.
Online store speed report
70% of consumers say that a slow page speed makes them less likely to buy.
And Portent found that ecommerce conversion rates decrease drastically for every second it takes your site to load.
In this article, we covered the ‘sweet spot’ for page load time.
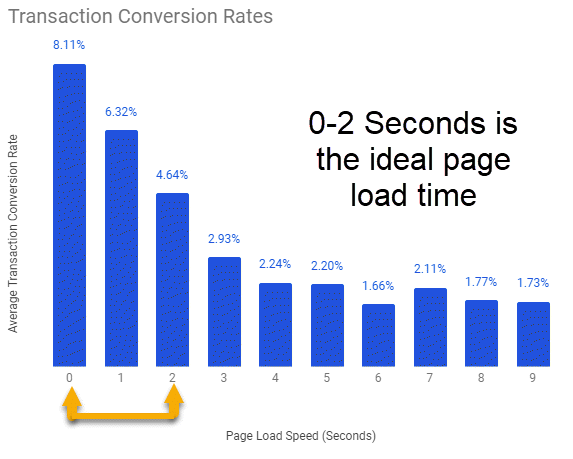
Way back in 2010, Google confirmed they use site speed as a factor when they decide where to rank your site on their Search Engine Results Pages.
Optimizing your online store speed can improve the shopping experience for your customers, increase your organic traffic from search engines and increase your conversions.
The Online store speed report will tell you how your store performs relative to other ecommerce stores in your industry.
How to speed up your Shopify store
If your store is slower than others, there are several simple improvements you can make:
- Compress your images with a Shopify app, reducing their file size and making the page quicker to load. Try Crush Pics, Minifier or SEO Optimizer.
- Create Accelerated Mobile Pages (AMP) to create lightning-fast pages that load quickly on smartphones and tablets. Remember, more than 50% of shoppers buy using mobile devices, so why not try out AMP by Ampify Me or AMP by Shop Sheriff?
- Reduce the number of apps you use. Manually audit your apps and uninstall any you don’t need.
- Switch to a fast, responsive Shopify theme that changes how your website is displayed based on your visitors’ device and screen size.If you want a more in-depth analysis of your site speed, try out Gtmetrix, Pingdom or Google PageSpeed Insights, and use an app or developer to carry out their recommendations.
Top online store searches report
Does your Shopify store have a search bar? Then click the ‘Top online store searches report’ to see what your visitors are searching for.
‘Original query’ will show you what your visitors typed, which allows you to adjust your product titles and descriptions to help your customers find what they’re looking for.
Make sure you also use the ‘Top online store searches with no results’ report to see why certain products didn’t trigger a result and add in the relevant keywords to your product descriptions to improve the customer experience.
If visitors are searching for something you don’t stock, you may want to add that product to your inventory, sharpish!
If you have lots of searches for a particular product, you can also take steps to make it easier to find - why not feature it on your homepage or create a new category called ‘most searched for’?
When Domu Brands chose to focus their efforts on improving their search functionality, they saw:
🚀 201% higher ecommerce conversion rate with search ( all devices)
🚀 185% lower bounce rate
🚀 254% longer avg. session duration
🚀 241% higher mobile conversion rate with search
Website cart analysis report
Want to know which products to show customers based on what they’ve already bought? The Website cart analysis report shows what percentage of the time your website visitors added a particular product to their cart and then also added another product.
This is a fantastic way to find links between products - for example, did 25% of customers who added a coat to their cart also add gloves? Or did someone who added hiking boots to their cart also add waterproof trousers?

Our analytics software Segments has a ‘Product Combos’ page which identifies which products were typically bought together.
Once you have this data, email people who bought one product, but not the other, to let them know they should check it out.
After all, you know from the Website cart analysis report that customers that buy the first product, usually go on to buy the second one too!
You can also optimize your product performance by adding a text link that says ‘customers that buy X also like Y’ to your product pages to increase the chances they’ll add both to their cart.
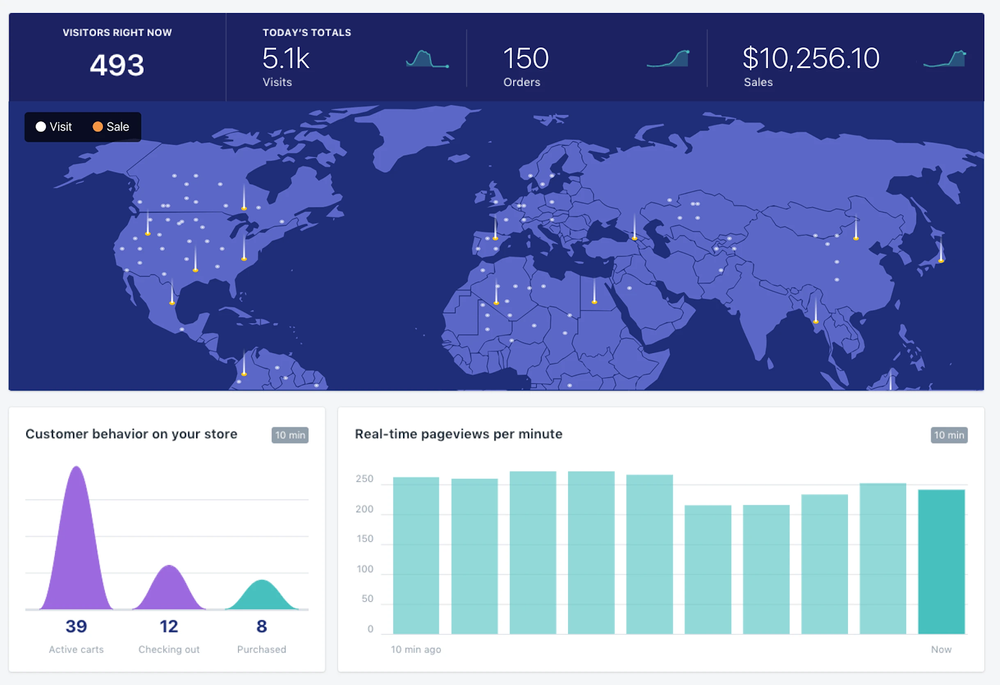
Shopify Live View
The final section under Shopify Analytics is ‘Live View’, which shows a real-time view of a world map so you can see how many visitors you have at that moment and where they’re coming from.
Besides peak shopping events like Black Friday and Cyber Monday, you shouldn’t spend much time looking at this. Yes, it’s fun for a while seeing where your customers are coming from and watching the visitor counter move up and down, but are you really going to change anything because of this information? Probably not.
The main exception to this advice is when you receive customer feedback that there’s an issue with the store. Shopify Live view can be helpful in understanding whether it was a one-off problem or if it’s a wider issue affecting other visitors.
Shopify Analytics 'Cheat Sheet'
Shopify Analytics can help you understand how your store is performing and how to improve it, but only if you know where to look.
That’s why we’ve taken the most common questions ecommerce store owners have about their data and listed exactly where to find the answers!
Sales FAQ
- How has my Average Order Value changed? Go to Reports > Sales > Average order value over time.
- What impact are discounts having? Go to Reports > Sales > Sales by discount to see which discounts were applied, how they were used and what type were used (e.g. percentage or fixed amount).
- How much inventory do I have and when do I need to restock? Go to Reports > Inventory.
- Which countries are my sales coming from? Go to Reports > Sales > Sales by billing country. If you’re getting organic sales from one region then it’s a good indication that you may have success with paid campaigns in that area as well.
- How many customers are making repeat purchases? Go to Reports > Customers reports > First-time vs returning customer sales. Although it varies, most ecommerce stores have a returning customer rate of between 25-30%. If you have a lower rate, consider reducing churn by creating a retention strategy.
Products FAQ
- Which products make up most of my revenue? Go to Reports > Inventory > ABC analysis by product. An A grade is given to products that collectively account for 80% of your revenue, B grade for those that generate 15% of your revenue and C-grade for the remaining 5% of your revenue.
- Which products should I feature on my home page or in special collections? Go to Reports > Behavior > Top online store searches to see products that visitors are struggling to find, or go to Products > All products > Insights > View details and pick one or two best-selling products.
- What should I call my products? Go to Reports > Behavior > Top online store searches. If users are searching for certain terms like sizes, price ranges, use cases or colors, make sure you add these to your products to make them easier to find and improve your SEO.
- Which new products should I stock? Go to Reports > Behavior > Top online store searches and if there are products that people are searching for that you don’t currently stock, it’s a good indication they will be popular.
- Which products should I remove from my Shopify store? Go to Reports > Sales > Sales by products and look for products that haven’t sold well over the last year. Hiding or removing these can speed up your store and improve your overall conversion rate by reducing choice paralysis.
Marketing FAQ
- Which channels are performing well or underperforming? Go to Reports > Sales > Sales by channel or Sales by traffic referrer.
- Where can I find potential affiliate partners who are already linking to me? Go to Reports > Sales > Sales by traffic referrer and look for websites that aren’t social media platforms to find suitable partners. Then reach out to them with an offer to collaborate.
- Are my SEO changes working? Go to Reports > Sales > Sales by traffic referrer to see if search engine referral traffic has increased and led to more sales.
- What impact are my paid traffic campaigns having? Go to Reports > Sales > Sales by traffic referrer to see if sales from whichever ad platform you’re using have increased.
- Is my brand awareness increasing? Go to Reports > Sales > Sales by traffic referrer to see if the percentage of traffic coming from ‘Direct’ has increased over time.
Now let’s look at what other data you should be gathering through Google Analytics…
How to add Google Analytics to Shopify
We’ve seen websites write articles like ‘Shopify Analytics vs. Google Analytics: which offers better ecommerce tracking?’
This completely misses the point. You should be using them both, together.
Here’s why.
Shopify Analytics isn’t perfect and it isn’t comprehensive. It doesn’t track all the customer or product data you need and it lacks functionality most marketers or ecommerce store owners will need once they begin to experience growth.
But luckily for us, Google Analytics has your back! It’s a free easy-to-use tool that offers a lot of the extra reporting functionality you’ll need.
When you connect your Shopify data with Google Analytics you should also enable Enhanced Ecommerce, which enables product impression, promotion and sales data to be recorded.
Fortunately, Shopify has already written an article which explains how you can add Google Analytics tracking code to Shopify, or you can watch the video below.
You can open a Google Analytics account here if you don’t have one already.
Using Google Tag Manager with Shopify
Once your Shopify store grows to a certain size, you’ll likely want to switch to using Google Tag Manager (GTM) to manage your Google Analytics, Facebook pixels and marketing tags.
You can use GTM to improve site speed, and add events and scripts without relying on developers.
Officially, Shopify only offers a direct GTM integration if your store uses Shopify Plus, but there are a few workarounds if you want to use it for smaller Shopify stores.
Is Shopify Analytics suitable for larger brands?
Once your ecommerce store hits a certain size (roughly 100+ orders per month with more than 10,000 customers), you’re going to need a more comprehensive solution.
Why?
Because you’ll want to do things like:
- Perform deeper analysis on your data.
- Analyse customer loyalty.
- Analyse the effectiveness of your marketing campaigns.
- Create segments based on:
- How many purchases customers have made.
- Email subscribers who have yet to purchase.
- Customers most likely to churn.
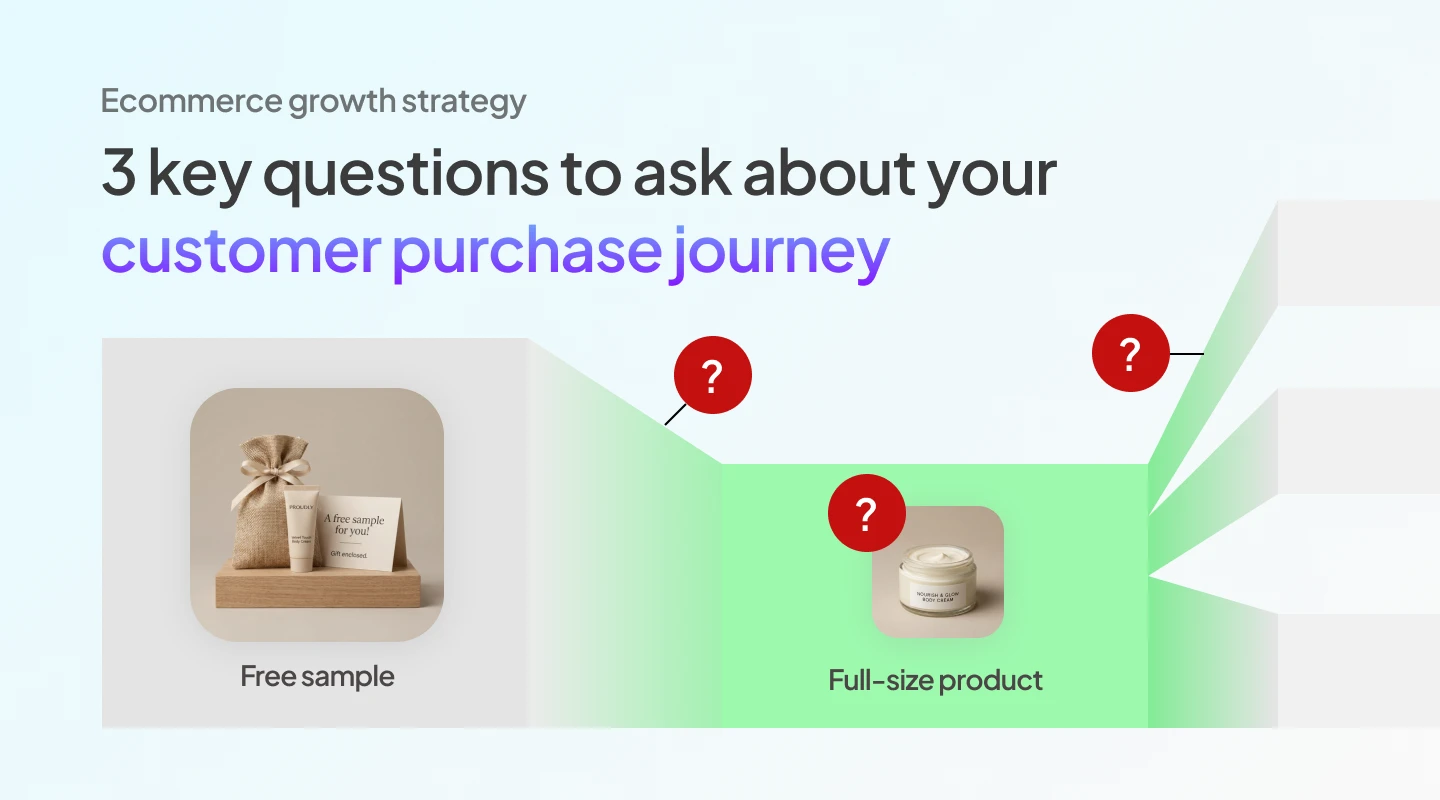
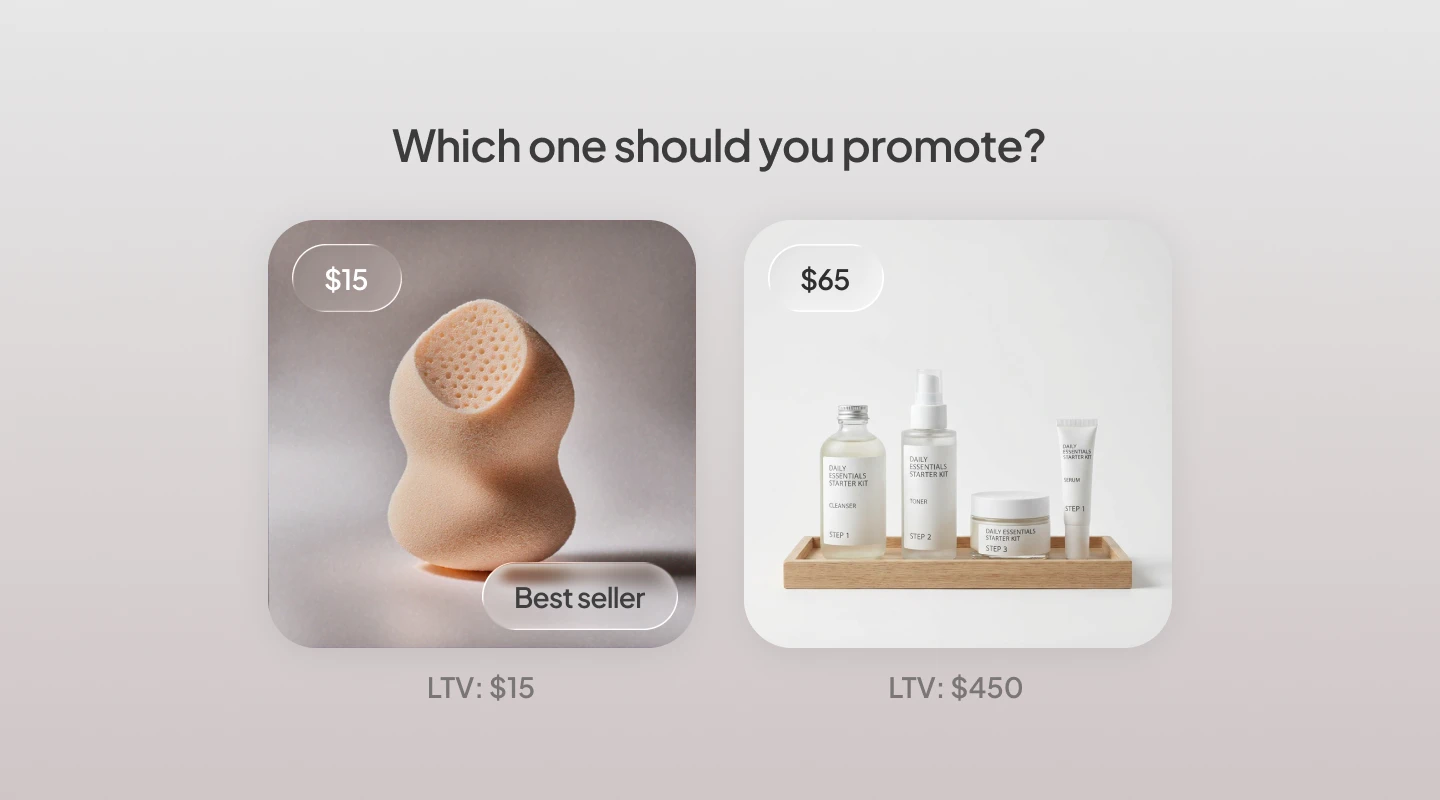
- Loyal customers.
- Customer Lifetime Value (CLV or LTV).
- Sync those customer segments to Klaviyo, Mailchimp, ActiveCampaign or Bronto.
- Upload specific customer segments to Facebook to create custom and lookalike audiences, as well as negative audience matching.
And you can’t do that sort of data analysis or customer segmentation with Shopify Analytics. You need a specialist tool like Segments by Tresl.
Segments was created by two LinkedIn data scientists who believe you shouldn’t need a degree in data science to grow your Shopify store.
If you’re an ecommerce store owner or marketer that needs more advanced data analysis, the ability to calculate Customer Lifetime Value, how to segment customers and market to them, then make sure to sign up to Segments’ free 14 day trial today.
It makes advanced data analysis and customer segmentation as easy as clicking a button.
Guest Author Bio
Nelson Jordan is a content strategist and creator who works with SaaS and ecommerce businesses. With more than 10 years’ experience working in digital marketing with more than 80 brands, contact him at www.nelson-jordan.com if you want your content to bring in more revenue.
Authored by
Tresl Data Science Team

George Sylvain
George Sylvain is a San Francisco-based DTC expert and co-founder of Social Print Studio, known for transforming e-commerce strategies into success stories. Visit his insights on AI and Shopify at www.georgesylvain.com.

Sharad Thaper

Alex Greifeld